In addition to the Metrorail ridership that NVTC reports on a quarterly and annual basis, NVTC staff recently completed its first in-depth analysis of Metrorail riders in Virginia based on data collected by WMATA in its 2016 Metrorail Passenger Survey.
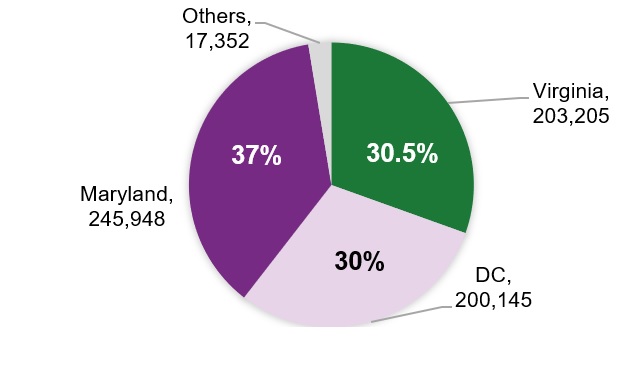
For riders from inside and outside of the region, Virginia riders comprise approximately 30 to 31 percent of average weekday trips
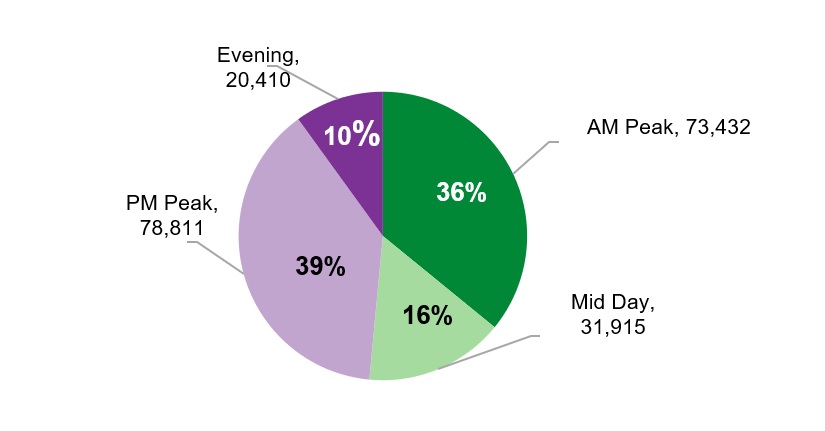
Seventy-four percent of trips by Virginia riders occur in the AM or PM peaks.
Virginia Metrorail riders live across Northern Virginia. More than 90 percent of Virginia riders live in NVTC jurisdictions: Arlington County, Fairfax County, Loudoun County, City of Alexandria, City of Fairfax, and the City of Falls Church. Reflecting the diversity of land use around stations and the multiple modes in which Virginians access Metrorail stations, approximately a third of Virginia riders live within a half mile of a Metrorail station.
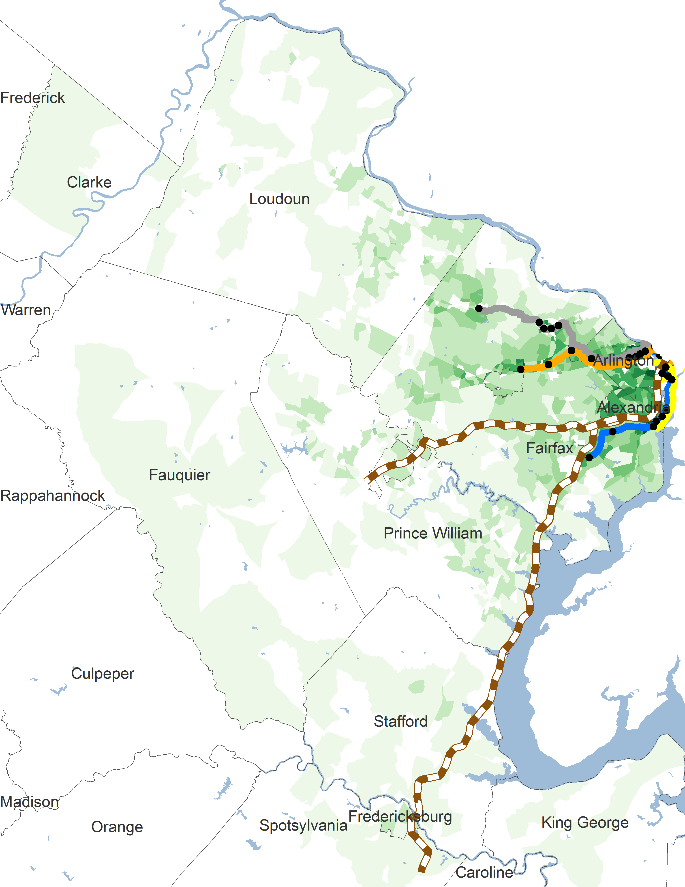
Note: Ridership is shown weighted by population in each Traffic Analysis Zone.
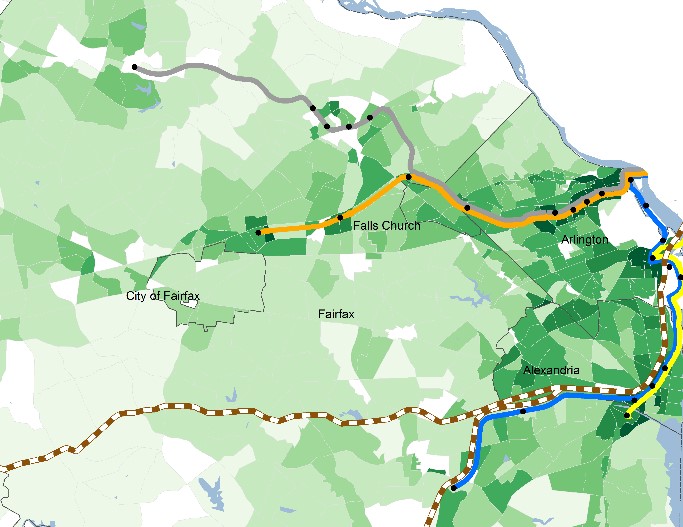
Note: Ridership is shown weighted by population in each Traffic Analysis Zone.
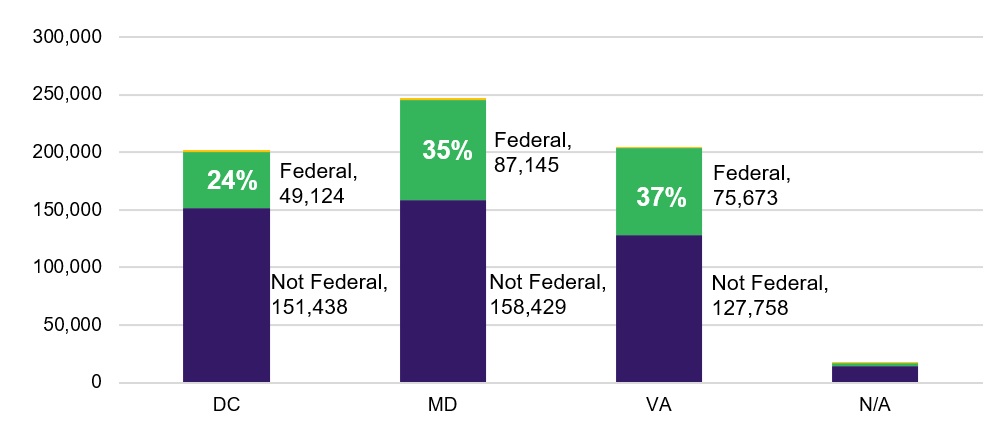
Thirty-seven percent of Virginia riders are federal employees.
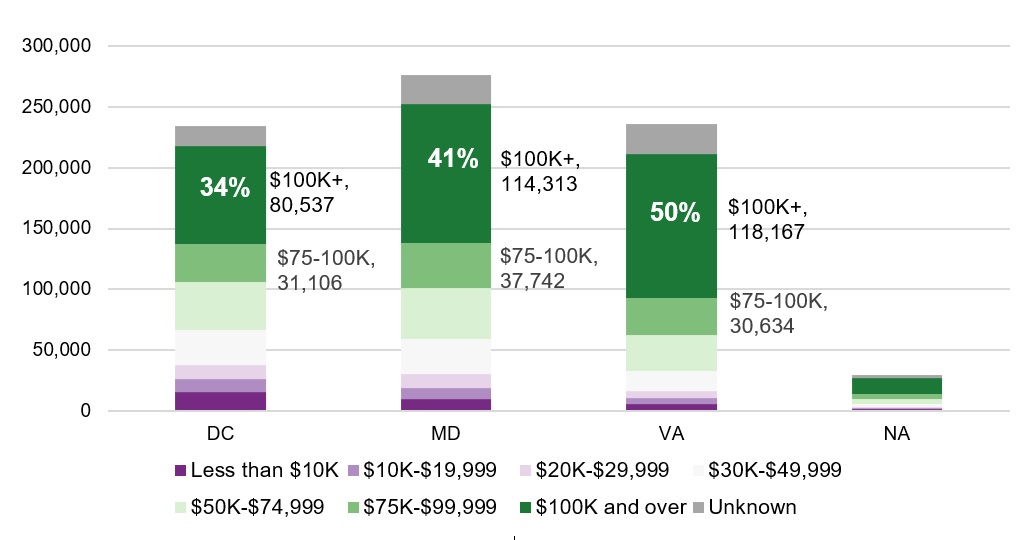
Over half of Virginia riders live in households earning more than $100,000 a year.
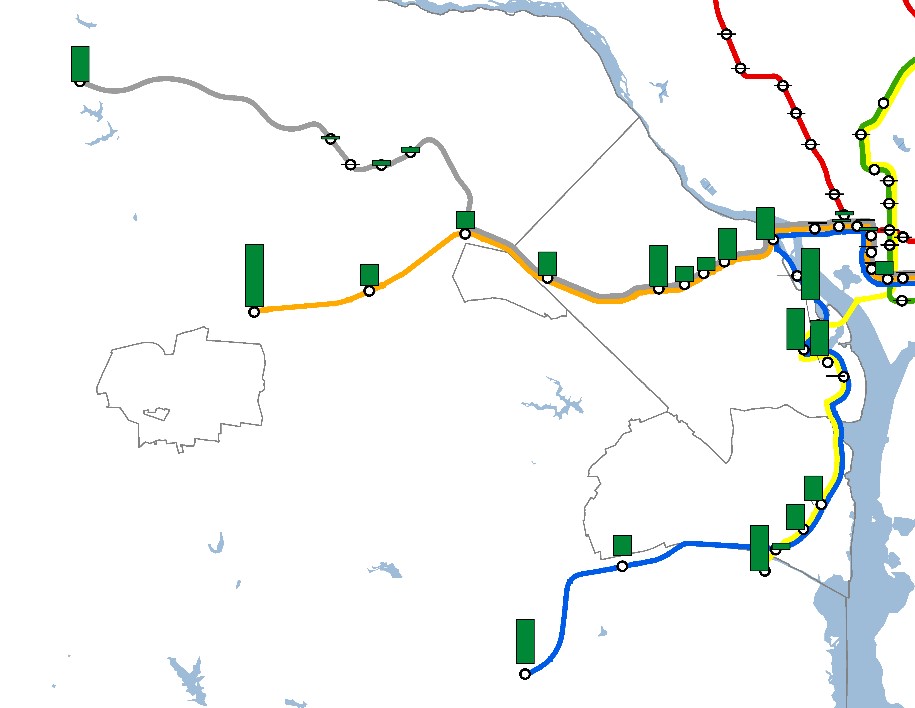
Some Virginia riders first enter the Metrorail system in the District of Columbia at L’Enfant Plaza, Union Station, and other downtown stations, demonstrating the role of commuter buses and VRE in Northern Virginia.
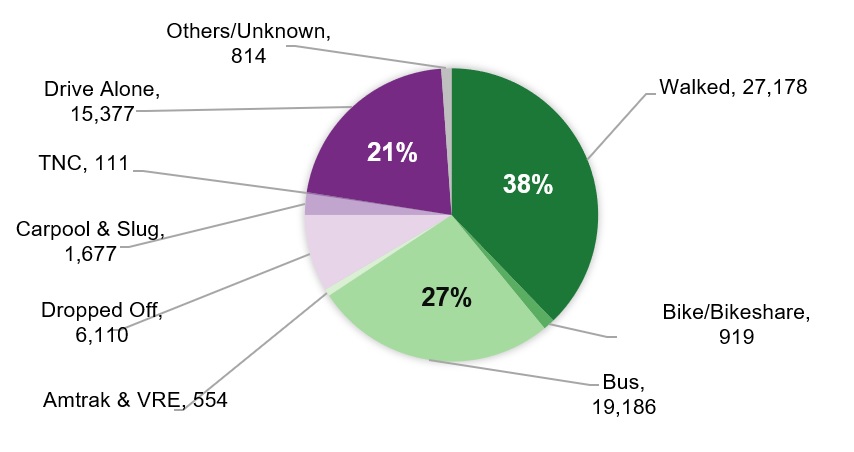
During the morning peak, most Virginia riders walk (38 percent), take a bus (27 percent), or drive alone (21 percent) to Virginia stations. Of Virginia stations, East Falls Church has the highest access by personal bike or bikeshare and Pentagon Station has the highest access by bus.
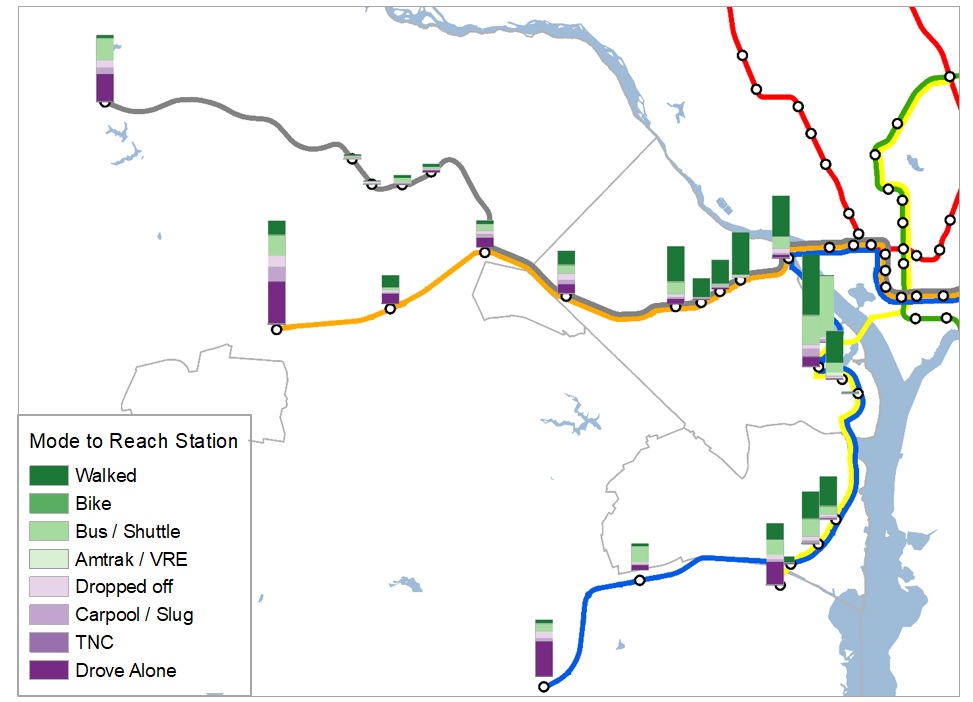
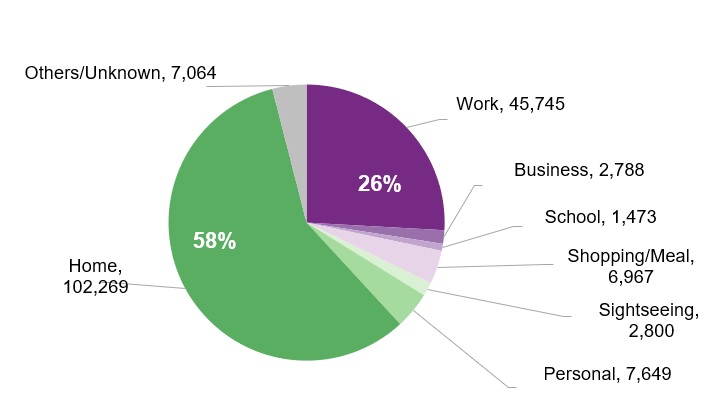
Ridership patterns at Virginia stations reflect land use. Large numbers of riders from across the region exit at Virginia stations to go to work, reflecting the concentration of employment and access to transit in Northern Virginia.
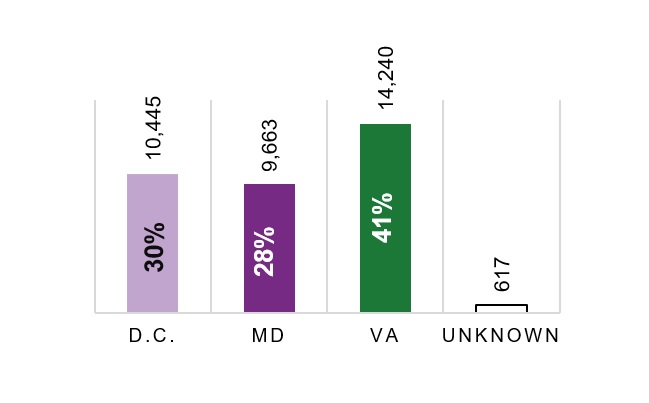
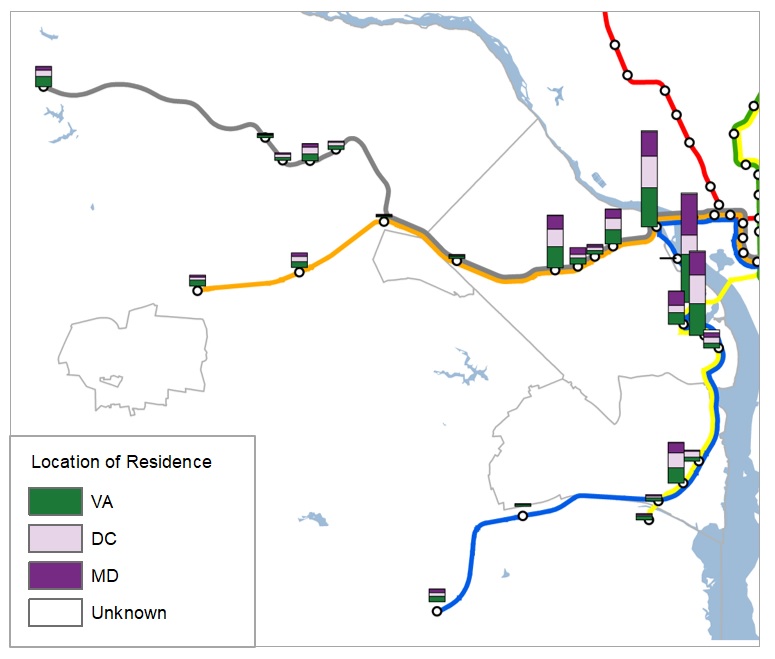
The destinations of riders exiting at Virginia Metrorail stations during the entire day demonstrates the distribution of uses around Virginia stations. Most riders are exiting to go home, reflecting a high amount of commuting to jobs by Virginia riders. Many riders, however, are exiting to go to work or for other reasons.
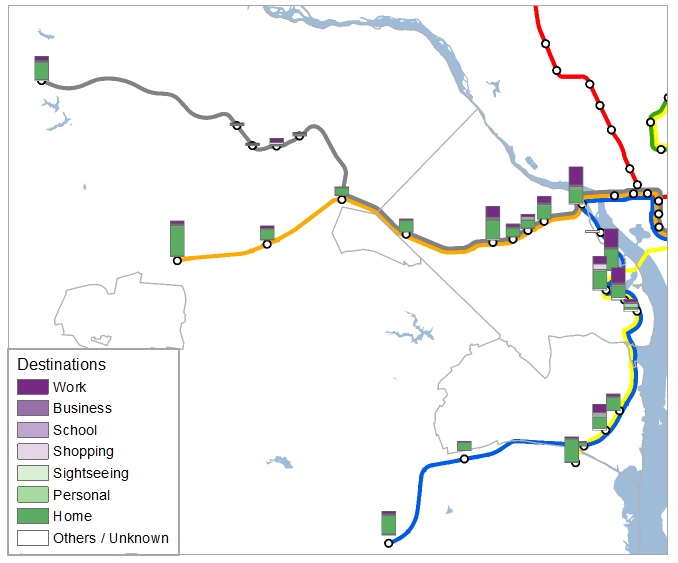
Source for all graphs and maps: WMATA 2016 Metrorail Passenger Survey
WMATA periodically conducts a passenger survey for budgeting purposes, Title VI compliance, and systems and operational planning. The survey focuses on ridership and travel characteristics and provides one of the inputs into the Metrorail operating subsidy allocation formula.
In 2016, WMATA conducted the most recent survey, updating the survey administered in 2012. The survey was distributed to riders at their stations of entry and asks questions about their Metrorail trip, where they live, and other demographic information. The survey also asked riders to provide information regarding their trips (e.g., origin, station of entry and exit, destination, and mode to reach Metrorail stations, etc.), as well as their background, jurisdiction of residence, income, and other demographic or geographic variables. This survey was conducted prior to the start of SafeTrack.
WMATA provided NVTC staff with the survey data for internal analysis and was provided with NVTC staff findings. NVTC staff focused its analysis on riders who live in Virginia, their travel mode to and from a station, and their trip purpose.
The weekday survey sample for the region distributed 266,554 surveys with 62,041 valid responses. The survey responses were weighted against observed ridership for a weighted survey total of 666,650 weekday riders.
